Monday, February 29, 2016

UniPhi 12 - Customer Dashboard

UniPhi's web application features a graphical Dashboards tab which presents a live and fully transparent view of your organisations project data. Among the available dashboards are Summary, Time, Submissions and Issues. Each of the UniPhi dashboards present a neat graphical summary view of the information stored in UniPhi, and are designed specifically to appeal to those of us who relate more to a graphical presentation of information than tables and data.

Based on requests and feedback from our clients we have expanded the selection of dashboards to include a new Customer Dashboard tab.

The latest view of your customer data

The Customer Dashboard presents the "Top 5" customers in terms of revenue and profit across your organisation. The dashboard contains 4 graphs which display your present top 5 customers for the quarter and over the past year with a comparison to the same time last year. 
The graphs each show:
- Top 5 Revenue in the Quarter
- Top 5 Profit in the Quarter
- Revenue by Customer
- Profit by Customer
See your most valuable customers, at a glance

Filters can be applied in order to view this valuable data through different lenses. For example you may be interested in seeing your top 5 customers across your entire portfolio, or per specific sector, project type, or by location. As you may be aware, each of the categories of information appearing in these filters is able to be defined by your UniPhi administrator so you will always have the ability to focus on the information that is most relevant to you and your organisation.


UniPhi dashboards adhere to our core design principles whereby data entered once is made available in numerous places, and in real time. This means that each time a revenue contract is created anywhere in your UniPhi deployment, the value of that contract will immediately update the customer dashboard, so you always see your top 5 as of right now. Having this information available dynamically means that you no longer need to wait for a report to be compiled, consolidated, and distributed to understand how your business its tracking today, and not last year, last month, or last week.

These are the four graphs we've developed so far but like all database driven systems, there's endless ways of aggregate customer data. Leave a comment on the blogger site if you think there are better metrics for customer information. Your thoughts will drive our next round of development.

Thursday, February 25, 2016

Benchmarking Series Part I - Data Capture and Quality Control

The Benchmarking Challenge

One of the biggest challenges for organisations when they want to benchmark is finding the relevant information in a way that is comparable across the things they're looking to benchmark. Perhaps user friendly software can help.

UniPhi's focus is on benchmarking everything cost and time related to construction projects. The range of this is almost endless and includes things like:

  • Average cost per m2/SF of floor area
  • Average elemental rates
  • Ratios between floor and wall areas
  • Revenue per net lettable area
  • Average duration of design phases
  • Average time to tender and procure 
  • Average time to achieve final account (We've gotten this down to two weeks for our construction clients)
  • Average percentage of variations to original price
  • Etc
Typically, this information is stored in spreadsheets and an email is sent around requesting people to send files for projects like XYZ. This is then consolidated and analysed by a BI team and hopefully some insights are obtained one to two weeks after the request went out.

Data Capture

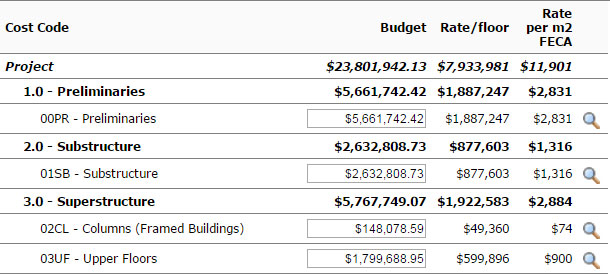
The way UniPhi has approached this issue is to make sure we integrate with as many underlying cost planning tools as possible and to streamline the process of importing an estimate into our Costs module. We then link this process to something of benefit to the person importing the plan. This is usually in the shape of assisting them to generate a report to a client (either internal or external). By making their life easier we have created an incentive to actually go to the trouble of importing the data into our application.

Classification

Once the data is captured, the next challenge is to make sure it is valid and to provide enough meta data or classifications to it to allow benchmarking end users to be able to obtain a collection of similar projects to benchmark against.

Firstly the meta data. All projects create in UniPhi require the classification of four customisable items to describe them. The out of the box labels for these are:
  1. Sector
  2. Project Type
  3. Service Line
  4. Location
Users of our software can then add an unlimited number of additional classification drop downs. The typical additional classifications are:
  1. Work Type
  2. Floor Area
  3. And some sector specific functional units like number of keys or apartments, theatres, or beds.
As these are mandatory fields when creating the project, you end up having classified a project as being in a Commercial Sector, Office Tower, Sydney, New Build,30,000 Sqm and 30 levels.

Add a project description and you've got a lot of information about the project already. The key with this meta data is that it is keyed in once. Then every piece of content created against that project subsequently inherits this meta data. So when the estimator or cost manager imports a cost plan into a particular project, the sector, project type, work type and floor area is automatically associated to this new piece of content.


Quality Control

At this stage we have a cost for a project and an association for the type of project but how do we quality control the data? This is where UniPhi's documents module comes into play. The documents system aggregates information stored in the rest of the application and workflows it to relevant parties for review and sign off. Only signed off pieces of information are available in the resulting benchmark reports.

Similarly, our new benchmark algorithm (See Part 4 of this series) relies on the certified progress claims of completed projects as the basis for generating phased forecasts.

At risk of stating the obvious, the quality of your information is crucial in generating useful benchmarking results, and with some simple rules and workflows embedded in the software, we believe this is not as difficult a task as it once was.


Results

Once we get lots of projects captured in our database, benchmarking is as simple as the query interface and resulting data set of sample projects ready for comparison.


Wednesday, February 24, 2016

Benchmarking - 4 Part Series

After a bit of a hiatus, the UniPhi blog is back. I have taken over the job of writing a weekly blog entry covering key problems our software is trying to solve. Over the next 12 weeks I will publish 3 new blog series with 4 articles in each series. The 3 series will cover the following key functions of UniPhi's software:

  • Benchmarking
  • Contract Administration
  • Cost Management
These three areas have become key areas of our application for our clients and we believe our approach to these areas is unique. Probably the most successful of all has been in benchmarking where we have been able to win back to back Australian Business Awards for innovation.

It is true that most of the work in this area has been for one of our fortune 500 clients (AECOM) and they won an excellent end product called Guide that provides their clients with benchmark data as well as the ability to price new projects within seconds using some key design parameters and the law of large numbers.

However, we have recently been able to take some of the learning from this work and incorporate the ability to capture key metrics into our application that due to its portfolio nature, already had significant benchmarking capability. This will be the topic of my first blog entry to be published tomorrow.